
JumalaSika ltd - Fotolia
Top 5 Linux performance commands for system administrators
Figuring out Linux host performance issues is time-consuming without the right tools. The top, vmstat, iostat, free and sar commands can help get CPU, device and memory data.
Performance management on Linux hosts is a task that takes time, knowledge of the command-line interface and a little bit of intuition. As a system administrator, you might rarely venture beyond the few commands you're familiar with or simply throw hardware, more memory and more CPU at perceived performance problems.
But five simple Linux performance commands can reveal a huge amount of detail about your host and help you quickly resolve your issues.
1. top
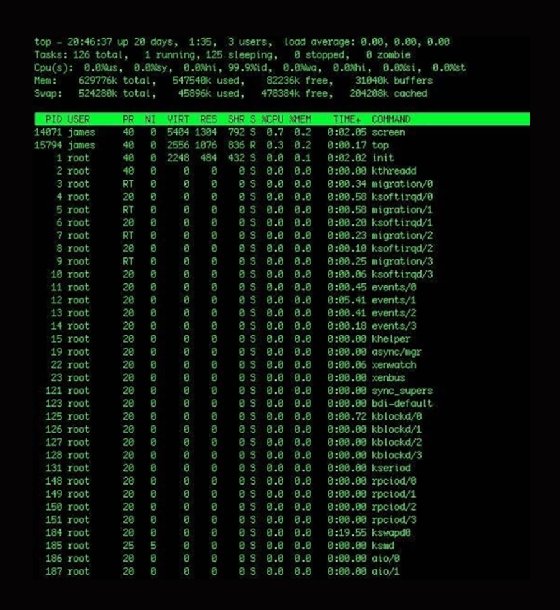
The top command shows what tasks the kernel currently supports, as well as some broad statistical data about the state of the host. The top command automatically updates this data every five seconds if you do not set a custom time frame.
This Linux performance command is comprehensive, and you may not use half of the available features.
To run top, start with an h keystroke for help or use the man page. The help prompt shows that you can add and subtract fields from the display, as well as change the sort order. You can also kill or renice particular processes using k and r, respectively.
The top command shows the current uptime, system load, number of processes, memory usage and distribution of CPU power. You can also get additional information about each process, including the user and any active commands.
2. vmstat
The vmstat command gives you a snapshot of current CPU, I/O, processes and memory usage. It dynamically updates and looks like:
$ vmstat 10
This version means that you receive updates every 10 seconds. The vmstat command writes the results of the check until you terminate the command with Ctrl+C or you specify a stop limit when originally writing the command. This continuous output is sometimes piped into files for trending performance, but there are additional commands that can more effectively collect large data volumes.
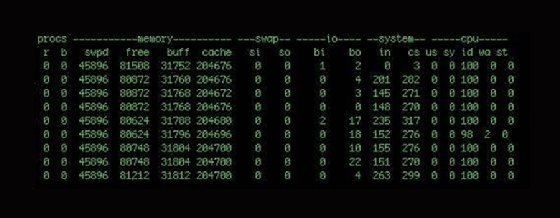
The first two columns show processes: The r column is the processes waiting for runtime, and the b column is any processes in uninterruptible sleep. If you have a number of processes waiting here, that means you've probably got a performance bottleneck somewhere.
The next four columns show memory: virtual, free, buffer and cache memory. The third heading, labeled swap, shows the amount of memory swapped to and from the disk. The fourth heading is I/O and details blocks received and sent to block devices.
The columns under the system heading contain the number of interrupts and context switches per second. The last five columns display system and CPU-related information. The CPU columns show a percentage of CPU time. The column entries are:
- us: time spent running user tasks and code;
- sy: time spent running kernel or system code;
- id: idle time;
- wa: time waiting for I/O; and
- st: time stolen from a VM.
The vmstat Linux performance command helps you see CPU usage patterns. Remember that each entry is generated depending on the delay and that short-term CPU monitoring may not be the best information source about actual CPU problems. You need to see long-term trends to get effective insight into CPU performance.
3. iostat
The iostat command provides three reports: CPU utilization, device utilization and network file system utilization.
If you run the command without any customization, it displays all three reports; you can specify the individual reports with the -c, -d and –h switches, respectively.
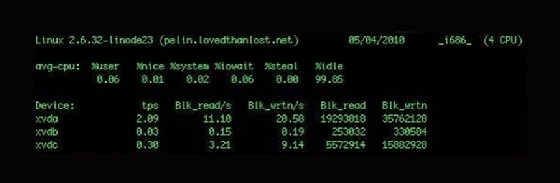
The example above includes two reports: CPU and device utilization. The first breaks the average CPU usage into category by percentage. It also includes user processes and system processes, as well as I/O wait and idle time.
The second report shows each device attached to the host and returns information about transfers per second and block reads and writes, as well as enabling you to identify devices with performance issues. You can display the statistics in kilobytes and megabytes, rather than blocks, with the -k or -m switches, respectively.
The iostat command can also report network file system utilization. Though not pictured, it shows similar information to the device utilization report, with data on network-mounted file systems instead of directly attached devices.
4. free
If you want memory statistics, free shows statistics for both main memory and swap.
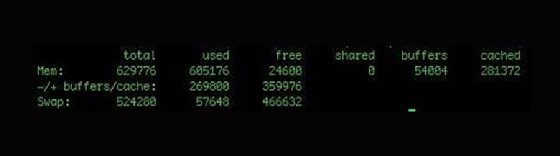
You can display the total memory amount by specifying the -t switch. To change the unit from the default kilobytes, use the –b switch for bytes and –m for megabytes.
You may continuously run free with the -s switch with a delay specified in seconds:
$ free -s 5
This refreshes the free command's output every five seconds.
5. sar
The system activity report, or sar, is a command-line tool for collecting, viewing and recording performance data. It has a variety of switches for customization and can collect and display data over longer periods than other performance commands. You can run sar without any options and get the following output:
$ sar
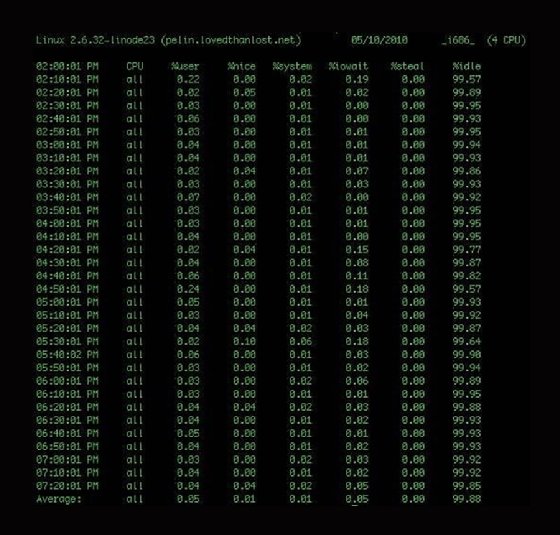
The basic sar output has CPU statistics for every 10 minutes and a final average. This average is from a daily statistics file that the system collects and rolls out every 24 hours. The files are stored in the /var/log/sa/ directory and named saxx, where xx is the collection date.
The sar command also collects statistics on memory, devices, network and blocks.
To specify what data is displayed, use the -b switch to see block device statistics, the -n switch to see network data and the -r switch to see memory utilization. You can also specify the –A switch to see all collected data.
You can run sar and output data to another file for more extensive data collection. To do this, add the -o switch and file name, the time interval between collections and the count of intervals to record. If you omit the count, then sar will continuously collect data:
$ sar -A -o /var/log/sar/sar.log 600 >/dev/null 2>&1 &
Here, you collect all data (-A), log to the /var/log/sar/sar.log file, update IT every five minutes continuously and then background the process. If you want to display this data back, add the -f switch like so:
$ sar -A -f /var/log/sar/sar.log
This displays all the data collected while you ran the sar job. You can also take and graph sar data using tools like ksar.
There is a lot of data available with the sar tool, and it can be a powerful way to review your host performance. For more details, review the sar man page.
In addition to these five commands, look at tools such as Munin and collectd. These resources collect performance, application and services data, and you can specify plugins. Both tools let you select a graphical data output and give you a visual representation instead of a text-based output.