
kentoh - Fotolia
An introduction to DCIM software metrics and terms
Infrastructure management is no easy task. The right software can help admins track how efficient their server racks and facilities are and pinpoint where to make improvements.

Data center infrastructure management is the coordination between IT and building facilities functions. Its ultimate task is to provide an overall view of data center performance for admins to use energy, equipment and floor space as efficiently as possible.
Originally based on building information modeling software, admins can use DCIM software functions to store and analyze data center data in real time. With schematic capabilities, the software also enables admins to create diagrams and generate equipment layouts.
To gather data, organizations use sensors and rack-mounted power distribution units to monitor power and cooling infrastructure. This helps admins generate detailed asset information for tracking and performance monitoring. For more continuous modeling, some IT teams will couple DCIM software with computational fluid dynamics offerings to analyze airflow and potential cooling issues.
Here's a look at the foundation of DCIM software and what admins can use it for.
Building management system
A precursor to DCIM software, building management systems monitor the mechanical, electrical and electromechanical components of a facility. This includes HVAC, power, physical access control, lights and pumping stations.
The basic version of a building management system includes software, a database server and connected smart sensors. As the sensors gather and send information to the database, the hardware is programmed to detect anomalies. Data center admins might set certain thresholds for temperatures to have the system send an alert for potential overheating.
Single pane of glass
The idea behind DCIM software is to help admins have a single pane of glass view of their data center infrastructure. This means that the software acts as a management console to present data from various sources on a unified display; admins can look at the dashboard of these program types and get a big picture of operations.
When it comes to single pane of glass offerings, there are key features to consider during selection. With the right features, admins can avoid data deluge or reports that make it difficult to pinpoint operational needs.
Admins should look for an intuitive GUI that is well laid out and easy to navigate; a customizable display that can be tailored to specific user requirements; and a reporting structure that makes data access easy.
Data center infrastructure efficiency
This metric helps determine how well an organization's infrastructure runs. Developed by The Green Grid, data center infrastructure efficiency (DCiE) is noted as a percentage.
To determine DCiE, admins can divide IT equipment power by total facility power. Then, multiply that number by 100 to get the percentage. To get these numbers, facility power can usually be observed from the facility utility meter. Total IT equipment power should be measured after power conversion, switching and conditioning. The main way to capture this measurement is through power distribution unit outputs for the computer room.
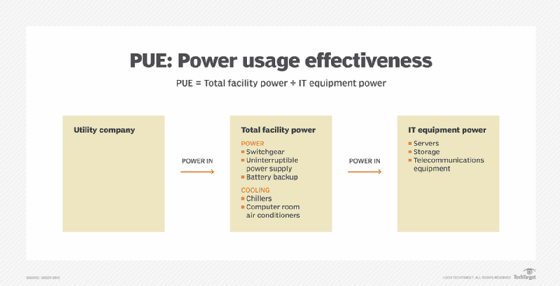
Power usage effectiveness
Specific to energy efficiency, power usage effectiveness (PUE) is another metric developed by The Green Grid industry group. It is the reciprocal measurement of DCiE, so admins can determine PUE with the following equation: PUE = total facility power/total IT equipment power.
PUE is expressed as a ratio and not a percentage, with the average data center at a PUE rating of 2.5. According to Uptime Institute, for maximum effectiveness, admins should strive to have a PUE rating of 1.6 for their data centers.
Water usage effectiveness
Organizations use water in the data center for cooling, humidity regulation, on-site electricity production and additional building requirements. The water usage effectiveness (WUE) metric can help organizations and admins understand how much water consumption affects the local electric grid -- and power resources.
For a basic calculation of WUE, admins divide the annual site water usage in liters by total IT equipment energy usage in kilowatt-hours. The Green Grid has more extensive calculations for specific types of WUE metrics.
To have a more holistic use case for WUE, admins can calculate the metric to use with PUE and carbon usage effectiveness. Monitoring these different components can make the data center more efficient and environmentally friendly.