How to install and configure MRTG, an essential sys admin tool
Multi Router Traffic Grapher (MRTG) is an essential tool that allows systems administrators to monitor and graph network traffic and more. In this tutorial, an expert explains how to install and configure MRTG on Solaris 10.
I've been a systems administrator for fifteen years, and during that time one of the most useful pieces of software I've put into production is Tobi Oetiker's MRTG, which stands for Multi Router Traffic Grapher. MRTG is not limited to visualizing network traffic -- it can graph just about any data that can be retrieved with Simple Network Management Protocol (SNMP) or custom scripts.
In this column, I'll provide a walkthrough on how to perform a basic install of MRTG on a Solaris 10 Update 7 x86 VMware virtual machine running in 32-bit mode, monitoring its own network usage. The host name for my example machine is "sol10vm," but yours will be different. MRTG also runs well on other versions of Solaris, other Unix distributions, Mac OS X, most types of Linux and even Windows.
Installing MRTG on Solaris 10: Prerequisites
This MRTG tutorial has a few prerequisites. Most of them are similar to those required for my article on installing Nagios on Solaris, but some pieces of software have been updated. It assumes that you've installed the GNU GCC compiler and GNU Make that come on the Solaris 10 installation disc (or a newer version from Sunfreeware), and that the compiler works properly. In most cases, this just involves adding /usr/sfw/bin to your PATH environment variable. If you can run 'gcc' and 'gmake' and get the following output, you're probably good to go.
root@sol10vm:/> gcc gcc: no input files root@sol10vm:/> gmake gmake: *** No targets specified and no makefile found. Stop.
Another requirement is that the SNMP daemon is configured on your system or the system/router you want to monitor. Solaris 10 uses the Net-SNMP package, and Sun's documentation for it can be found here. For our purposes, you want a public community string with read-only access to network interface performance data. In short, you can usually edit /etc/sma/snmp/snmpd.conf as needed, then run svcadm enable sma as root to start things up. To test your SNMP daemon, run snmpwalk -v 1 -c public localhost. If you get a lot of scrolling output, things are working.
For this demonstration, I'm using the Apache Web Server packages provided by Steve Christensen's Sunfreeware project, specifically Apache 2.2.11 and its dependencies (the expat, libiconv, openldap, sasl, zlib, openssl and libgcc packages). Building MRTG from source also requires that the gd (and its dependencies, xpm, fontconfig and libintl), libpng and jpeg-6b libraries are installed. These packages will install under /usr/local, so make sure that /usr/local/bin is in your PATH and that /usr/local/lib and /usr/local/ssl/lib are in your system library search path (use crle; see "man crle" for details).
Once you've edited the file /usr/local/apache2/conf/httpd.conf and started the Web server with /usr/local/apache2/bin/apachectl start, going to "http://yourhostname" with a Web browser should look something like this:
Click to enlarge.
Downloading and building MRTG
As of May 2009, the current version of MRTG is 2.16.2, and it can be downloaded from http://oss.oetiker.ch/mrtg/pub/. Once the source code is downloaded, uncompress it into a location of your choice (I like to use /usr/local/src out of habit), change into the mrtg-2.16.2 directory, and run ./configure. The configure script will check your system for MRTG's prerequisites, then configure the software's build environment. As it finishes running, a message that says, "Config is DONE!" will appear and return you to a command prompt. At this prompt, you can then type "gmake" to build MRTG (it will only take a few seconds), and then "gmake install" to install MRTG under /usr/local/mrtg-2.
Configuring Apache for MRTG
There's not a lot of configuration required for Apache in order to work with MRTG. In most cases, creating a directory for your MRTG graphs and data files (in this case, /usr/local/apache2/htdocs/mrtg) will suffice.
How to configure MRTG
Change to the directory that you've created for your MRTG data files and use MRTG's cfgmaker script to automatically "walk" the SNMP tree of your device (in this case, the Solaris system that everything runs on).
root@sol10vm:/usr/local/apache2/htdocs/mrtg> /usr/local/mrtg-2/bin/cfgmaker public@localhost > mrtg.cfg
This will create a basic configuration file called mrtg.cfg that is set up to monitor the single Ethernet interface on the machine ("e1000g0"). However, the file still needs minor edits. Open it in your favorite text editor and make the following changes:
- Uncomment the first WorkDir line and change the path to
/usr/local/apache2/htdocs/mrtg. This tells MRTG where to store its data files. - Uncomment the Options line and remove ",bits". This makes the graphs update so that the most recent data is on the right-hand side and shows traffic in bytes.
Running MRTG
To test your MRTG installation, run the MRTG script that was installed in /usr/local/mrtg-2/bin, giving it your newly created mrtg.cfg file as a parameter: root@sol10vm:/usr/local/apache2/htdocs/mrtg> /usr/local/mrtg-2/bin/mrtg ./mrtg.cfg 2009-05-25 19:03:39, Rateup WARNING: /usr/sfw/mrtg-2/bin/rateup could not read the primary log file for localhost_2 2009-05-25 19:03:39, Rateup WARNING: /usr/sfw/mrtg-2/bin/rateup The backup log file for localhost_2 was invalid as well 2009-05-25 19:03:39, Rateup WARNING: /usr/sfw/mrtg-2/bin/rateup Can't remove localhost_2.old updating log file 2009-05-25 19:03:39, Rateup WARNING: /usr/sfw/mrtg-2/bin/rateup Can't rename localhost_2.log to localhost_2.old updating log file
These warnings are expected and can be safely ignored the first time you run MRTG with a new configuration file -- it's complaining about not finding older log files to rotate or update.
If you look at the list of files that MRTG just created, one of them is HTML. If you open that file with a Web browser -- assuming everything was installed correctly -- the page will look something like this:
Click to enlarge.
This is nice, but we want to create a good index page for your MRTG installation, using the indexmaker script provided with the software: root@sol10vm:/usr/local/apache2/htdocs/mrtg> /usr/local/mrtg-2/bin/indexmaker ./mrtg.cfg > index.html
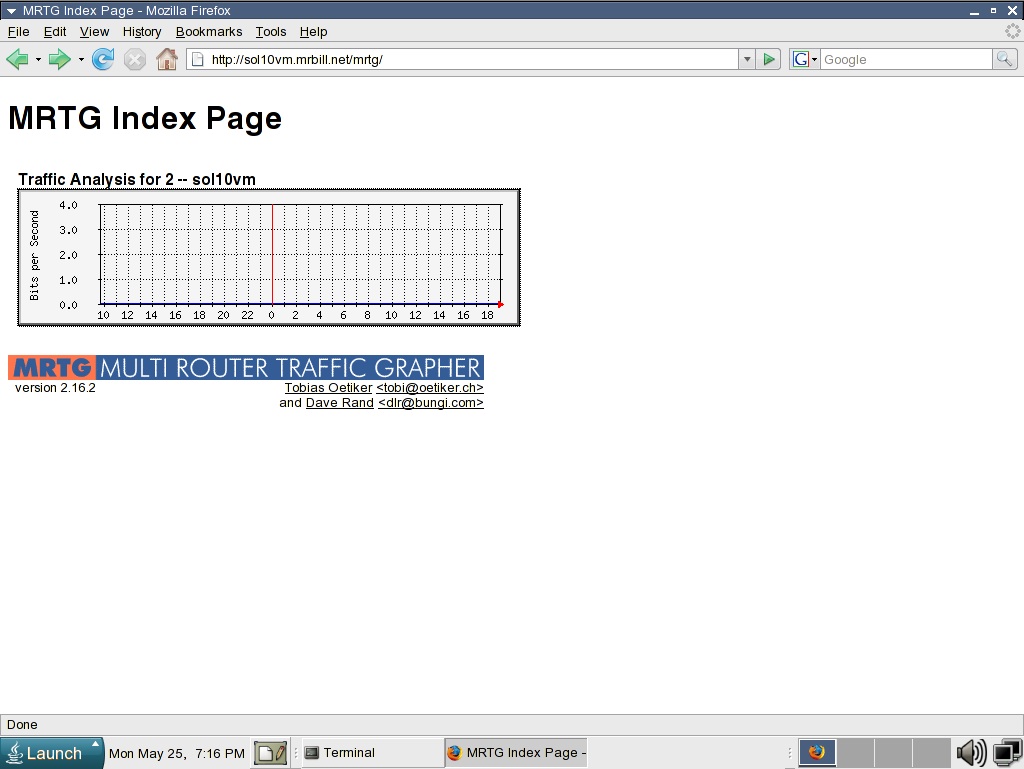
This will result in a nicely formatted MRTG index page that comes in handy once you add multiple systems and interfaces to your MRTG configuration. It gives you a mission control-style overview of everything and lets users drill down to see specific interfaces and historical graphs.

Click to enlarge.
You'll notice that there are no data lines in the graph. This is because it was just created and has not been collecting data. In order to do that, you'll need to automate the MRTG command you just ran. I like to do this by creating a small shell script that is run by crontab.
In the directory that houses your MRTG configuration and data files, use your favorite text editor to create a Unix shell script that will run MRTG on demand. I like to call it do-mrtg, and mine looks something like this:
#!/bin/bash PATH=/usr/local/bin:/usr/bin:/sbin:/usr/sbin:/usr/ccs/bin:/usr/ucb export PATH cd /usr/local/apache2/htdocs/mrtg /usr/local/mrtg-2/bin/mrtg ./mrtg.cfg
Make the script executable (chmod 700 do-mrtg), and run it once to test:
root@sol10vm:/usr/local/apache2/htdocs/mrtg> ./do-mrtg root@sol10vm:/usr/local/apache2/htdocs/mrtg>
No output is good -- this means that the script ran MRTG and updated the data and log files with no problems.
To finish automating the MRTG data collection, add this script to the system crontab, set to run every five minutes. To edit the crontab, make sure your EDITOR environment variable is set (mine is set to "vi"), and run crontab –e. The line to add to crontab should look like this:
0,5,10,15,20,25,30,35,40,45,50,55 * * * * /usr/local/apache2/htdocs/mrtg/do-mrtg > /dev/null 2>&1,/pre>
This will run the do-mrtg script and redirect any output (errors, warnings, etc.) to /dev/null.
After a while (depending on activity), you should have visible lines for incoming and outgoing traffic as well as numerical stats on the pages for specific network interfaces. If not, or if the numerical stats continually return "NaN" (not a number), check the MRTG log file and run MRTG again by hand to see what the problem is.
Further reading on MRTG
I suggest reading through the MRTG documentation and numerous third-party examples available on its website to get a deeper understanding of how MRTG works and how to interface it with more than just SNMP data.
Check in soon for my article on speeding up MRTG using RRDTool, another software offering from Tobi Oetiker.
ABOUT THE AUTHOR: Bill Bradford is the creator and maintainer of SunHELP and lives in Houston, Texas, with his wife Amy.
What did you think of this feature? Write to SearchDataCenter.com's Matt Stansberry about your data center concerns at [email protected].