Free DownloadData Storage Management: What is it and Why is it Important?
With this guide, explore what data storage management is, who needs it, advantages and challenges, key storage management software features, security and compliance concerns, implementation tips, and vendors and products.
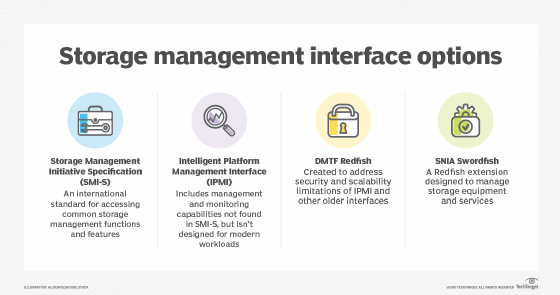
Choose the right storage management interface for you
While older storage interfaces were created to meet international standards at the time, storage has evolved, and updated interfaces may be required to manage your infrastructure.
As enterprise workloads grow more complex and diverse, IT teams require storage they can centrally manage and monitor with as few tools as possible, regardless of which vendor manufactured the components. They also require storage that can be integrated into the larger data center management environment to support more unified efforts and flexible operations.
A growing number of vendors are responding to these needs by incorporating a standards-based storage management interface into their products. Two of the most common standards are the Storage Management Initiative Specification (SMI-S) and the Intelligent Platform Management Interface (IPMI). Both have been widely implemented, but they're starting to show their age, particularly the IPMI, and the industry is now looking to two newer standards -- Redfish and Swordfish -- to address today's data center infrastructures.
Storage Management Initiative Specification
The Storage Networking Industry Association (SNIA) developed SMI-S to provide an international standard for accessing common storage management functions and features. SMI-S facilitates access to a variety of storage attributes and properties and includes features that support security, virtualization, discovery and other operations.
Because the SMI-S is a standards-based storage management interface, SMI-enabled management applications can control a wide range of storage products. The standard helps streamline management, consolidate tooling and eliminate vendor lock-in, enabling you to use the best storage for your specific workloads without implementing additional tools or incurring unnecessary overhead. According to SNIA, over 1,350 storage products now support the SMI-S.
To facilitate access to their devices, vendors typically offer SMI-S providers. A provider is a software component that acts as an interface between the storage device and management software in order to carry out administrative tasks. For example, IBM offers an SMI-S provider for managing its DS3000, DS4000, DS5000 and DS6000T platforms. Dell EMC offers an SMI-S provider for its PowerMax and CLARiiON systems. Vendors such as Hewlett Packard Enterprise (HPE) and Pure Storage also provide storage products that support the SMI-S.
Intelligent Platform Management Interface
IPMI is much broader in scope than SMI-S, offering management and monitoring capabilities for different types of hardware components, including storage. IPMI provides a standardized message-based interface that works in conjunction with the baseboard management controller (BMC), a hardware chip attached directly to a system's motherboard. The BMC, in turn, provides interfaces for tracking numerous parameters and carrying out remote operations such as powering systems on and off.
The IPMI storage management interface has been around for over 20 years and is widely implemented in data center systems. Administrators can connect remotely to these systems to perform various management tasks, using a common set of tools to control and monitor storage systems, servers, switches, power supplies and other IPMI-enabled components. Not only does IPMI simplify operations, but it can also help to reduce costs and administrative overhead.
In addition to other types of hardware, numerous storage products also support the standard, such as the IBM Cloud Object Storage System and Hitachi VSP G130. IPMI can also benefit consolidated infrastructures that incorporate storage, such as Cohesity's C6000 series high-density hyper-converged nodes.
Unfortunately, IPMI was not designed for today's workloads and doesn't meet modern security and scalability requirements. In fact, the four IPMI promoters – Dell EMC, HPE, NEC and Intel -- have announced that there will be no further updates to the IPMI specification and encourage hardware vendors and IT managers to transition to more a more modern storage management interface.
DMTF Redfish
Formerly known as the Distributed Management Task Force, DMTF created the Redfish standard to address the security and scalability limitations of older management interfaces such as IPMI. Redfish is an open, industry-standard schema and specification designed to provide simple management capabilities for converged infrastructures, hybrid environments and software-defined data centers.
Redfish and Swordfish are not the only emerging standards out there.
Redfish is based on common internet and web services standards and is both human readable and machine capable. Hardware vendors are quickly adopting the standard because it enables simple and secure management of modern data center infrastructures. With Redfish, administrators can use client scripts to control large scale-out environments. Redfish provides a comprehensive RESTful API that can interface with a wide range of data center components, including storage devices, multinode servers and hybrid infrastructures.
Because Redfish is better suited to modern infrastructures than previous interfaces, vendors are adopting the standard in their storage products. Supermicro has implemented Redfish feature sets on its Intel X-10 and AMD H11 platforms, enabling uniform administration across heterogenous hyperscale data center environments. The Redfish components extend to storage management and RAID configurations, with support for such components as Broadcom and Marvell controllers.
HPE has also incorporated Redfish into several of its Edgeline converged edge systems, as well as its ProLiant Gen10 servers.
SNIA Swordfish
Not long after Redfish appeared on the scene, SNIA began developing the Swordfish specification. Swordfish is a Redfish extension designed specifically to manage storage equipment and services. Swordfish uses the same RESTful API as Redfish to offer more granular storage capabilities than what Redfish can provide on its own. Swordfish employs standards-based technologies such as JavaScript, OData and HTTPS, facilitating storage management across diverse environments.
Swordfish is predicted to replace SMI-S in the same way Redfish is starting to replace IPMI. Swordfish promises to offer a more unified approach to storage and server management for hyperscale and cloud infrastructures, while ensuring readability, security and compatibility. The new standard also works across multiple network fabrics, including Ethernet and Fibre Channel, and supports storage interfaces such as SAS and PCIe.
Although Swordfish is a relatively new standard, vendors are starting to incorporate it into their products. For example, the Dell EMC DSS 9000 rack scale infrastructure supports both Redfish and Swordfish, enabling compute, storage and networking resources to be provisioned and managed as a unified system. The standards also make it possible to compose systems from within the rack and across the data center. Pure Storage has also been actively involved in the Swordfish effort.
Standards-based storage
Redfish and Swordfish are not the only emerging standards out there. The NVM Express organization, for example, now offers the NVMe Management Interface specification, which was released in 2015 to improve SSD management. In the meantime, the IPMI and SMI-S still have a strong presence and will likely be around for a while, given the number of existing systems that support these interfaces.
Even so, standards such as Redfish and Swordfish are better suited to today's workloads and infrastructures, aiming to consolidate and simplify management across the entire data center. IT teams that plan to invest in storage any time soon should ensure the storage they choose can meet their management demands now and in the foreseeable future, taking into account the storage systems and administrative tools they already have on hand.